217 countries. Eight household scenarios. A completely rebuilt methodology. The most comprehensive open-access living wage dataset available.
Download the Living Wage Global Dataset 2026
The relevance of living wage data
Living wage is one of the most important numbers in sustainability. It determines whether a worker can afford food, housing, healthcare, and education for their family, or whether they fall short. It is the threshold between decent work and working poverty. And yet, for most companies and investors, it remains remarkably hard to pin down.
Part of the problem is data. Living wage estimates vary widely depending on the source, the methodology, and the assumptions behind them. Some cover only a handful of countries. Others rely on outdated price data or opaque calculations. For organisations trying to assess their supply chain impact or benchmark labour practices across geographies, the landscape is fragmented and expensive.
That is why Valuing Impact publishes this dataset for free.
The reasoning is simple. Living wage data should not be locked behind paywalls when the people most affected by wage gaps are the ones least able to pay for the research. If the goal is to shift corporate behaviour and investment decisions toward fairer wages, the underlying evidence needs to be accessible to everyone, from multinational companies running supplier audits to NGOs advocating for policy change to researchers studying inequality.
The 2026 edition represents the most significant update since the dataset was first published. The methodology has been rebuilt from the ground up, the data sources are fully refreshed, and the coverage now spans 217 countries across eight household scenarios.
What changed in the methodology
The 2024 dataset was a solid starting point, but it had limitations. The 2026 edition addresses them systematically.
The cost-of-living model now follows the Anker and Anker (2017) framework, which is the most widely accepted standard for living wage estimation. It builds a household budget from seven cost components: food, housing, transport, healthcare, education, clothing and communications, and a contingency margin. Each component is priced using Numbeo’s crowdsourced cost-of-living data for 101 countries and 188 cities, cross-referenced against World Bank indicators for taxes, unemployment, fertility rates, and purchasing power parity.
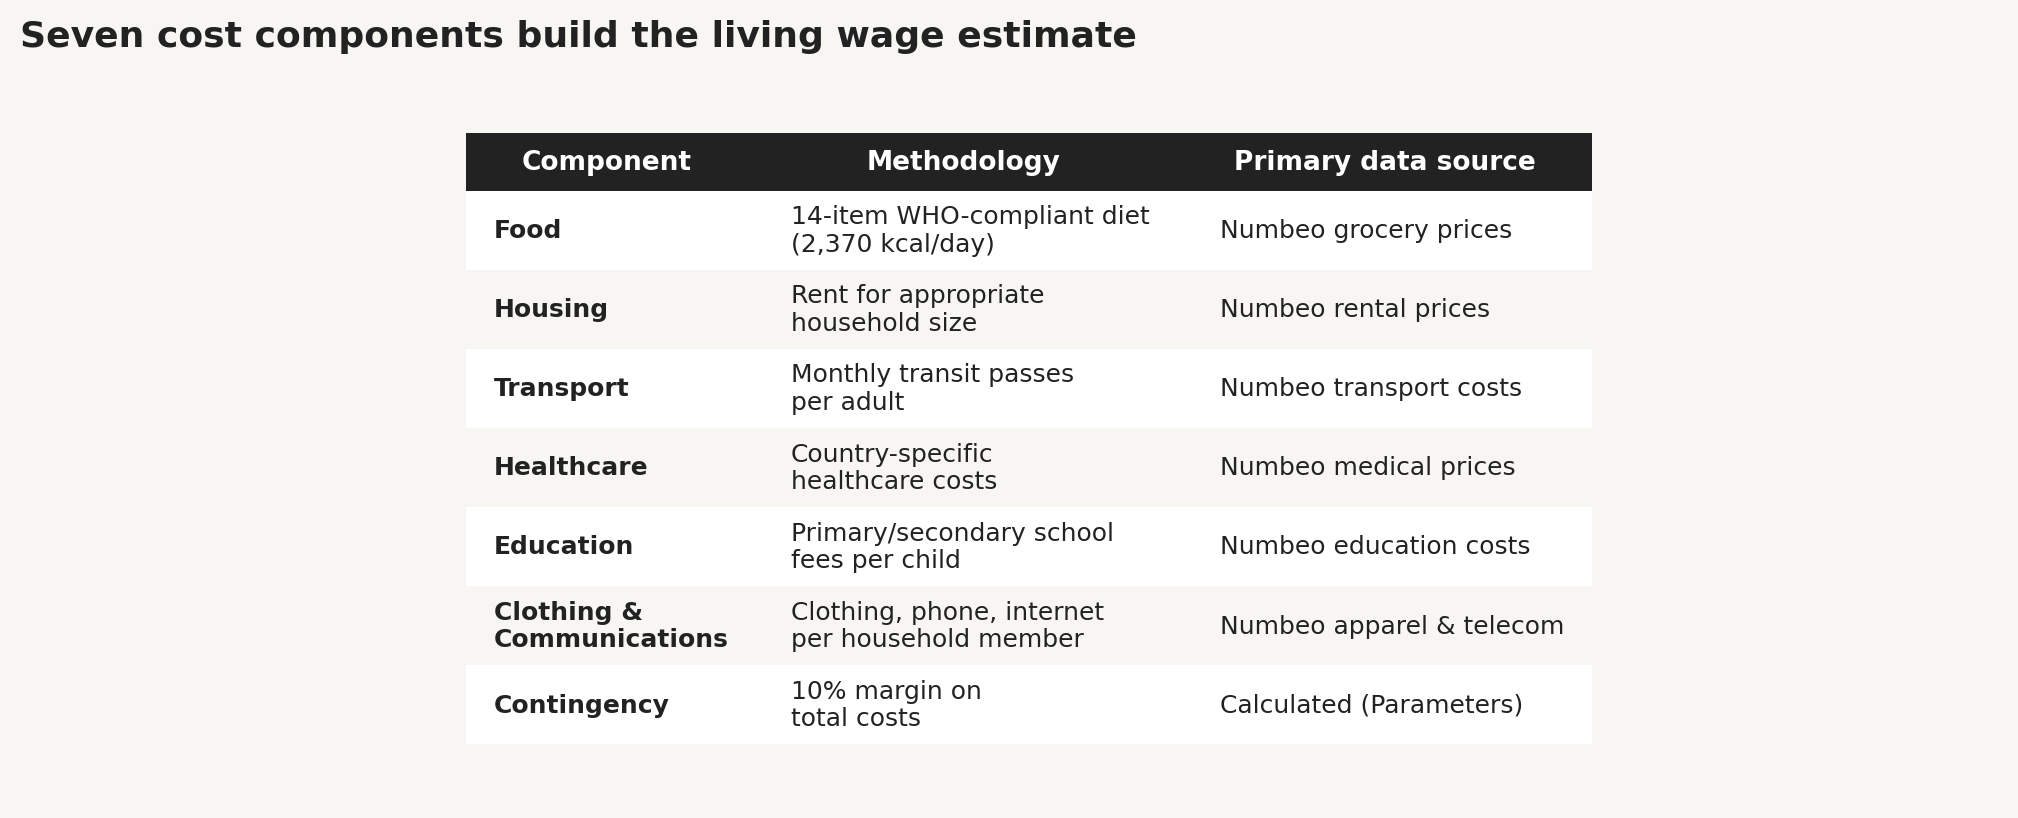
The food component deserves particular mention. Rather than using a single food cost index, the model constructs a 14-item representative diet that meets WHO nutritional guidelines, targeting 2,370 kilocalories per day with appropriate macronutrient balance. Each food item maps to a specific Numbeo price category, which means the diet cost reflects actual local prices rather than abstract indices.
For countries where Numbeo does not have sufficient price data, the model uses a PPP-based regression to estimate living wages. The equation is a log-log model where the natural logarithm of the living wage is predicted from the natural logarithm of PPP conversion factors. This approach captures the non-linear relationship between price levels and living costs, and it performs well across income groups. The regression runs on roughly 99 data points per scenario, with R² values between 0.60 and 0.70. Countries that lack even PPP data fall back to income-group averages as a final safety net.
The result is a three-tier estimation system. 100 countries have direct Numbeo-based estimates (Tier 1). Another 91 countries use the PPP regression model (Tier 2). The remaining 26 use income-group averages (Tier 3).
Eight household scenarios cover the range of household structures that matter for wage adequacy analysis. Standard Family (two adults, two children) and Typical Family (two adults, country-specific fertility-rate children) represent dual-earner households. Single Individual and Single Parent (one adult, two children) capture single-earner situations. Each scenario is computed for both urban and rural settings, with rural costs adjusted downward using component-specific multipliers.
The 2026 edition also went through a rigorous seven-layer model review that caught and corrected several formula errors from the initial build. Transport cost calculations for single-person households were overstated by 80%. The gross wage calculation for single earners incorrectly applied an employment-rate adjustment meant for multi-earner households. And a name-mapping error between data sources meant that 13 countries, including South Korea, Russia, and Turkey, were excluded from the regression model entirely. All of these have been fixed, and the corrections are documented in the accompanying methodology notes.
What the data shows
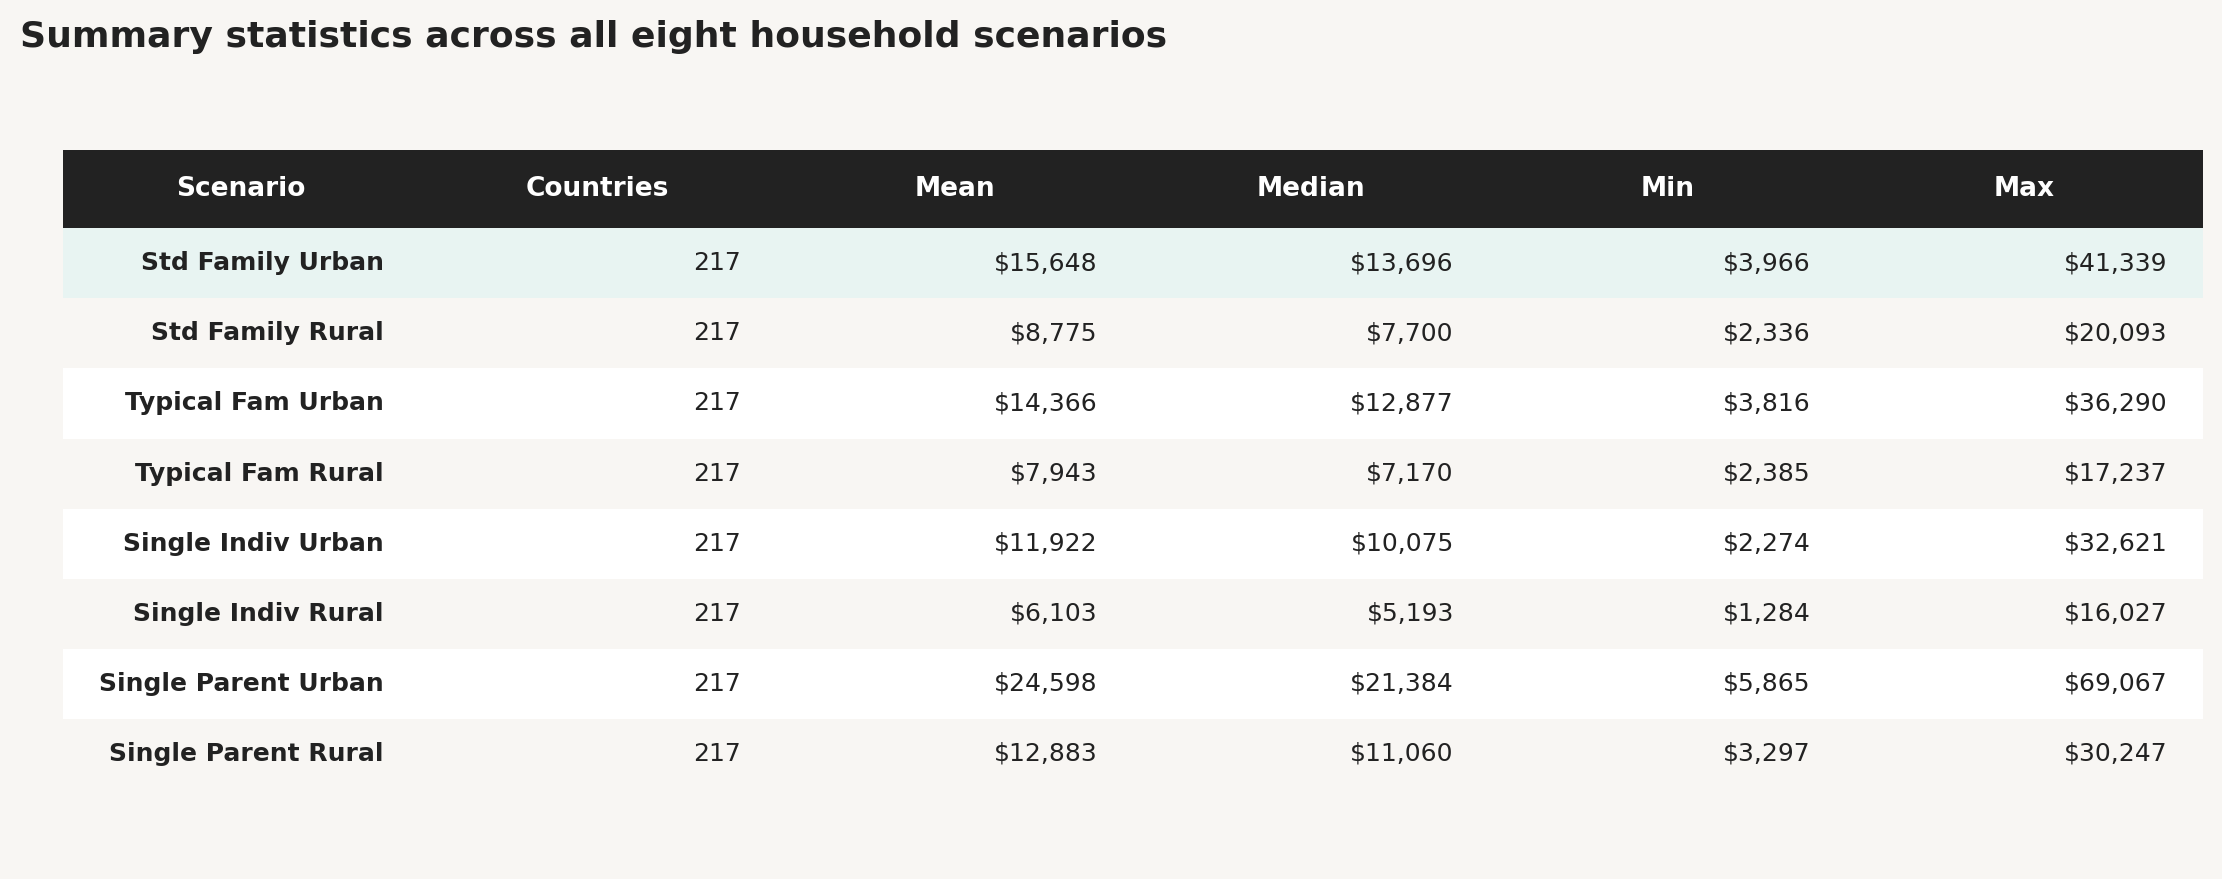
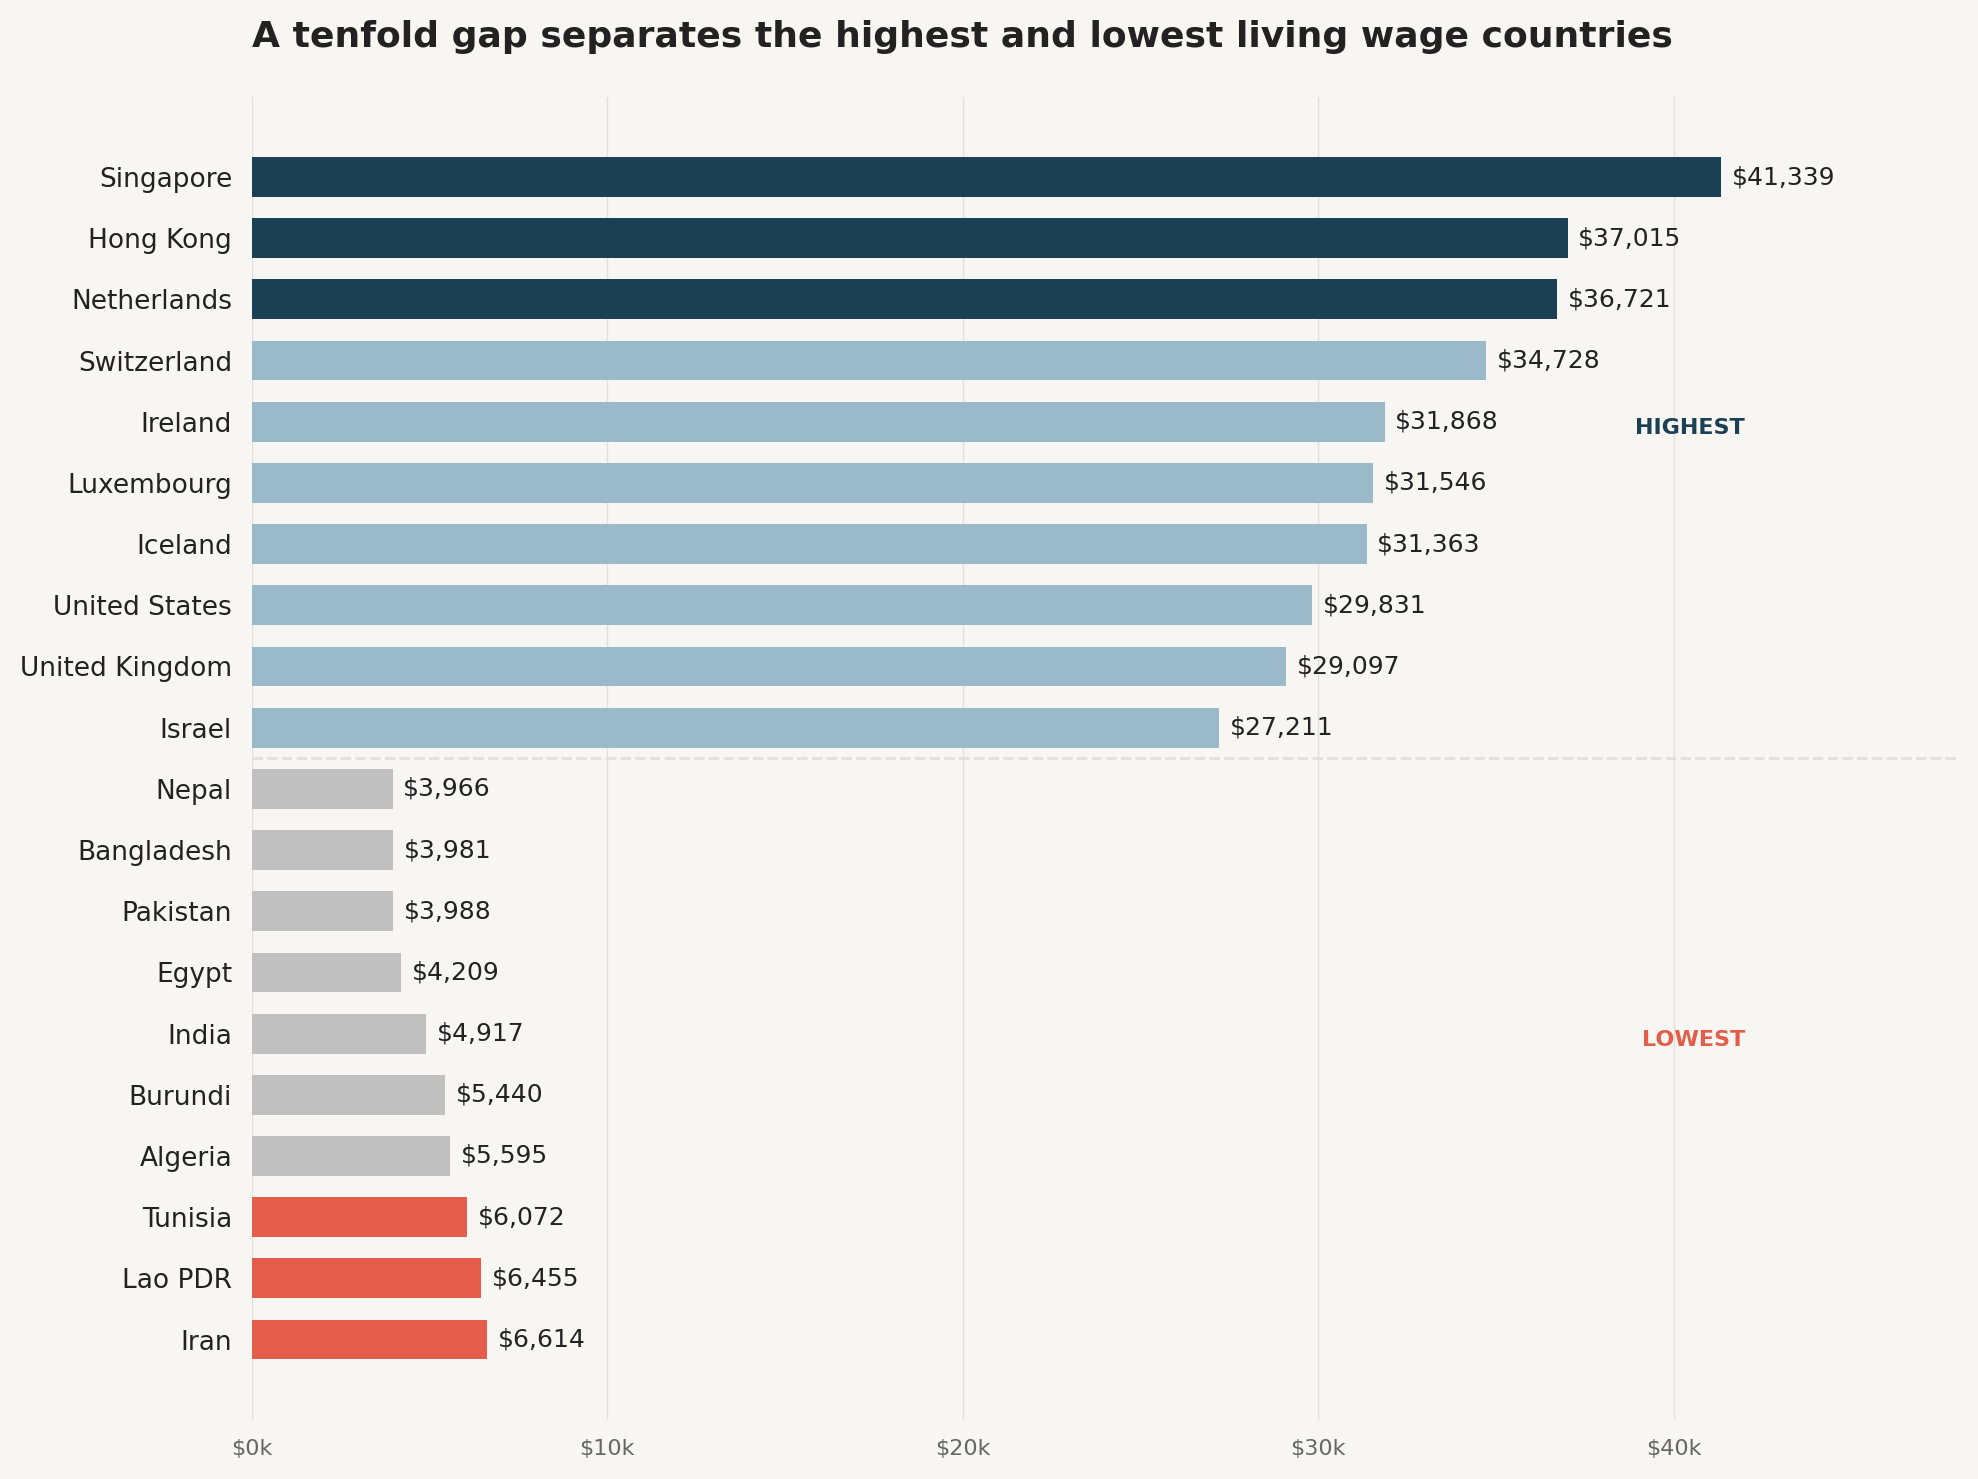
Taking the Standard Family Urban scenario as the reference point, the global picture is striking. The mean living wage across 217 countries is $15,648 per year. The median is lower at $13,696, reflecting a right-skewed distribution where a smaller number of high-cost countries pull the average up.
The range is enormous. Nepal sits at the bottom with $3,966 per year, while Singapore tops the list at $41,339. That is a ratio of more than ten to one. Five countries (Singapore, Hong Kong, the Netherlands, Bermuda, and Switzerland) require annual household earnings above $35,000 to meet a basic living standard. At the other end, five countries (India, Egypt, Pakistan, Bangladesh, and Nepal) fall below $5,500.
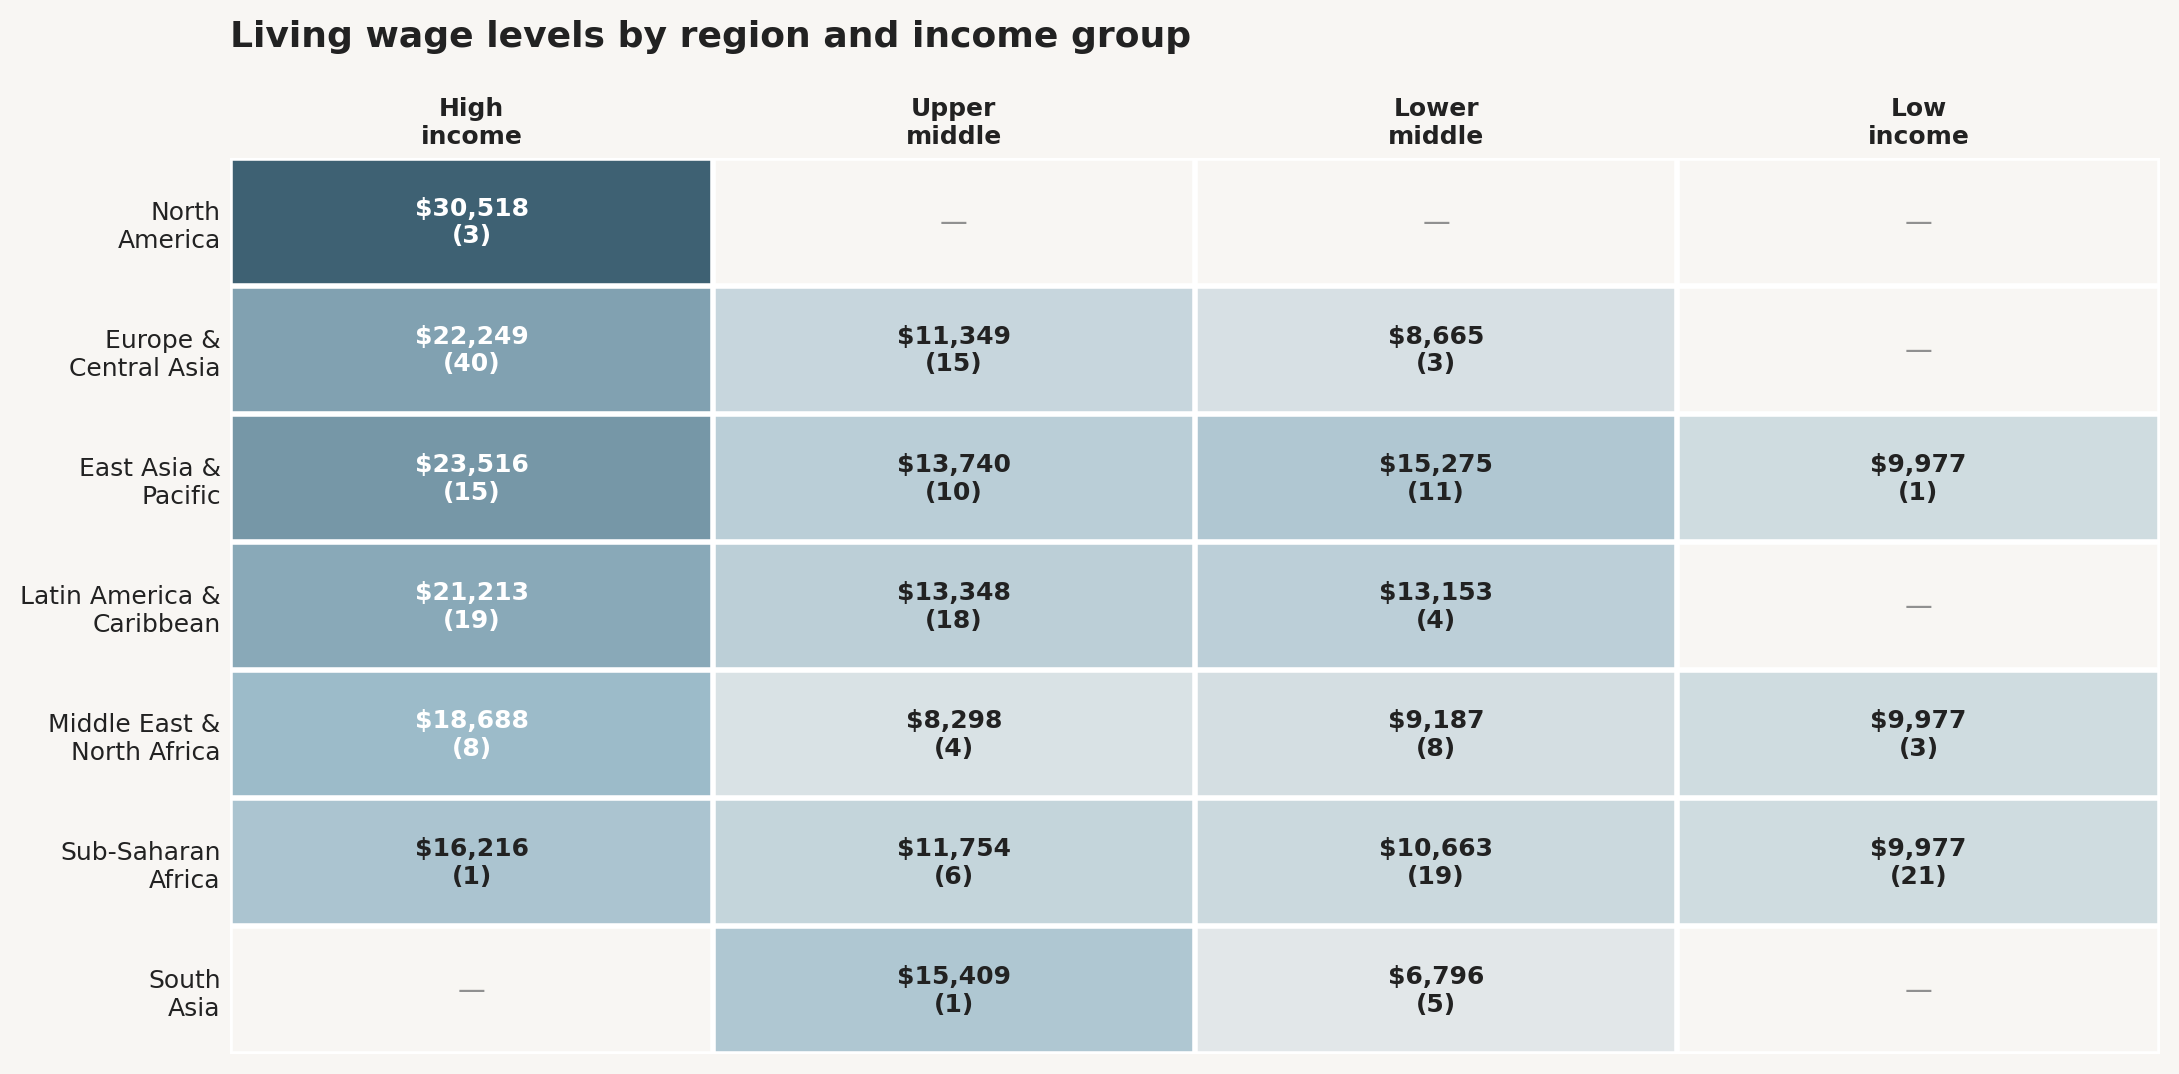
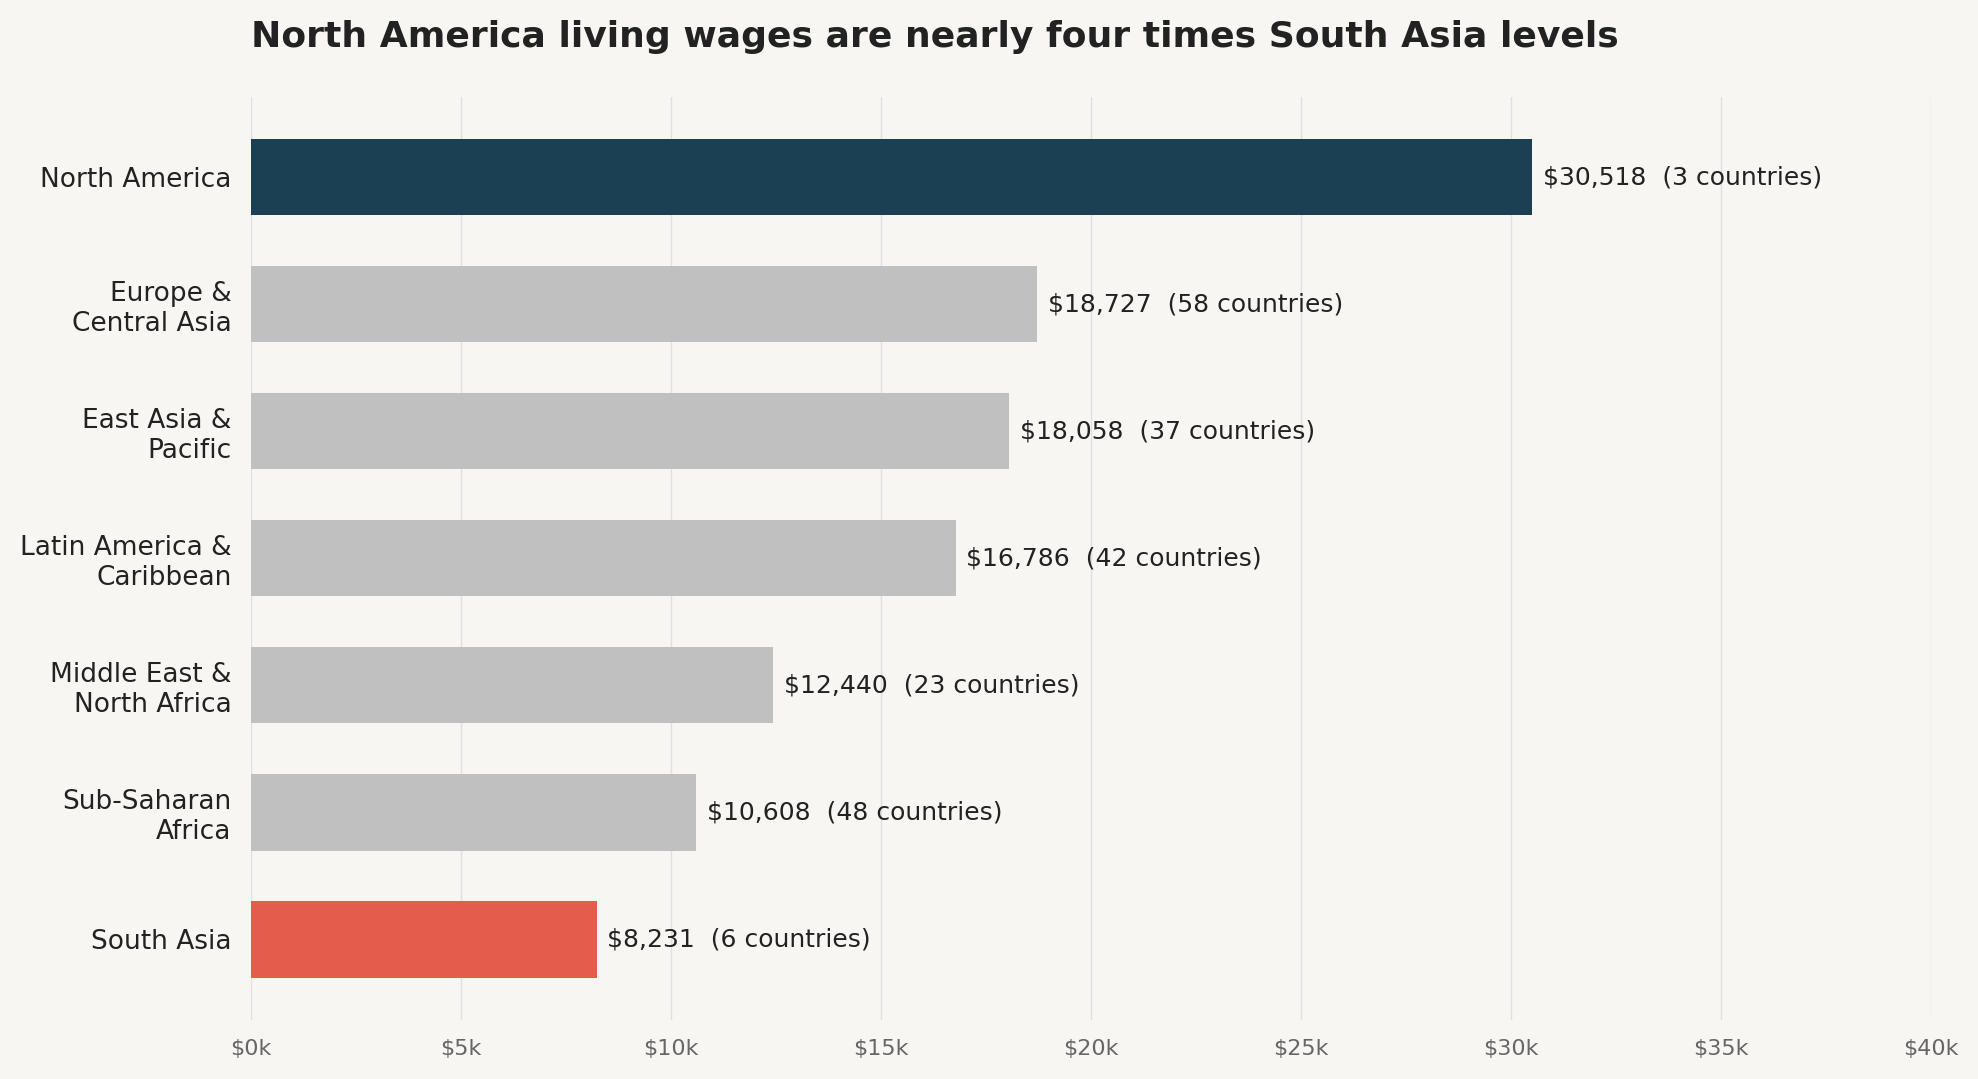
Regional averages tell a familiar story. North America leads at $30,518, followed by Europe and Central Asia at $18,727. Latin America and the Caribbean come in at $16,786, and the Middle East and North Africa at $12,440. Sub-Saharan Africa averages $10,608, East Asia and Pacific $18,058, and South Asia sits lowest at $8,231.
Income-group breakdowns are equally telling. High-income countries average $22,128, upper-middle-income countries $12,352, lower-middle-income countries $11,134, and low-income countries $9,977. The fact that low-income countries average slightly above lower-middle-income countries is worth noting. It reflects the small sample size (only 25 low-income countries) and the influence of a few higher-cost economies in that group rather than a genuine inversion of the expected pattern.
The rural-urban gap is consistent across regions. Rural living wages average roughly 55 to 60 percent of urban values, reflecting lower housing and transport costs outside cities. This discount is largest for housing (where rural costs are approximately 60% of urban) and smallest for food (where rural prices are roughly 90% of urban).
How it compares to the 2024 dataset
The 2024 and 2026 datasets differ enough in methodology that direct country-level comparisons should be interpreted with caution. The 2026 edition uses a fundamentally different cost model (Anker and Anker component-based versus the 2024 approach), updated price data, and corrected formulas. Changes in individual country estimates therefore reflect both genuine cost movements and methodological improvements.
That said, the broad contours are consistent. The correlation between the two datasets is strong for high-income countries and weaker for lower-income countries, which is expected since the methodology changes affect data-sparse countries most. The 2026 estimates tend to be somewhat higher on average, driven primarily by updated food and housing cost data and the correction of the tax default (which previously understated gross wages for countries without tax data).
Why this matters for sustainability strategy
Living wage gaps are one of the clearest indicators of social impact in any supply chain. When a company’s workers or suppliers’ workers earn below a living wage, the effects ripple outward through families and communities: poorer health outcomes, lower educational attainment for children, higher household debt, and reduced economic resilience.
For impact valuation, living wage data is foundational. It provides the reference point against which actual wages are measured, allowing organisations to quantify the gap in monetary terms and convert it into well-being impacts using frameworks like the eQALY methodology. Without a credible, country-specific living wage benchmark, impact statements and social return on investment calculations lack a defensible baseline.
For investors, living wage data supports due diligence on portfolio companies and helps identify where social risks are concentrated geographically. For companies, it enables wage gap analysis across operations and supply chains, and informs target-setting for living wage commitments. For policymakers and advocates, it provides comparable cross-country evidence that can inform minimum wage debates and social protection design.
The dataset is also relevant for CSRD and double materiality assessments, where companies need to evaluate their actual and potential impacts on workers across their value chains. Living wage gaps are a material social impact by almost any reasonable threshold.
Download the dataset
The full dataset is available for free download at valuingimpact.com. It includes 217 countries across all eight household scenarios (urban and rural), with source classifications so that users can see which countries are based on direct cost data, regression estimates, or income-group averages.
Valuing Impact maintains this dataset as part of its mission to make impact measurement accessible and evidence-based. If you use the data in your work, a citation or acknowledgement is appreciated but not required.
For questions about the methodology, custom analysis, or how to integrate living wage benchmarks into your impact measurement framework, reach out!